Sponsored ads:
Mid term:
–>
1. The first line we draw is the resistance trend line marked as 1.
2. The second line we draw, is the support trend line marked as 2.
3. resistance trend line marked as 3.
4. Fibonacci retracement marked as 4.
We can see that the 1 line is still strong and forms a strong resistance for the S&P index in the short term.
Lines 2 and 3 forms together a canal that brakes at the end. since the support line 2 was broken, it now will become a resistance line for the future.
We can see that the index stoped at the fibonacci line of 38.2%, if the index will go under this line, it we will probably fall all the way to the 50% fibonacci line, that also integrates with the 140 points line. My guess is that this will be our next support line.
Long term:
–>
Sponsored ads:
–>
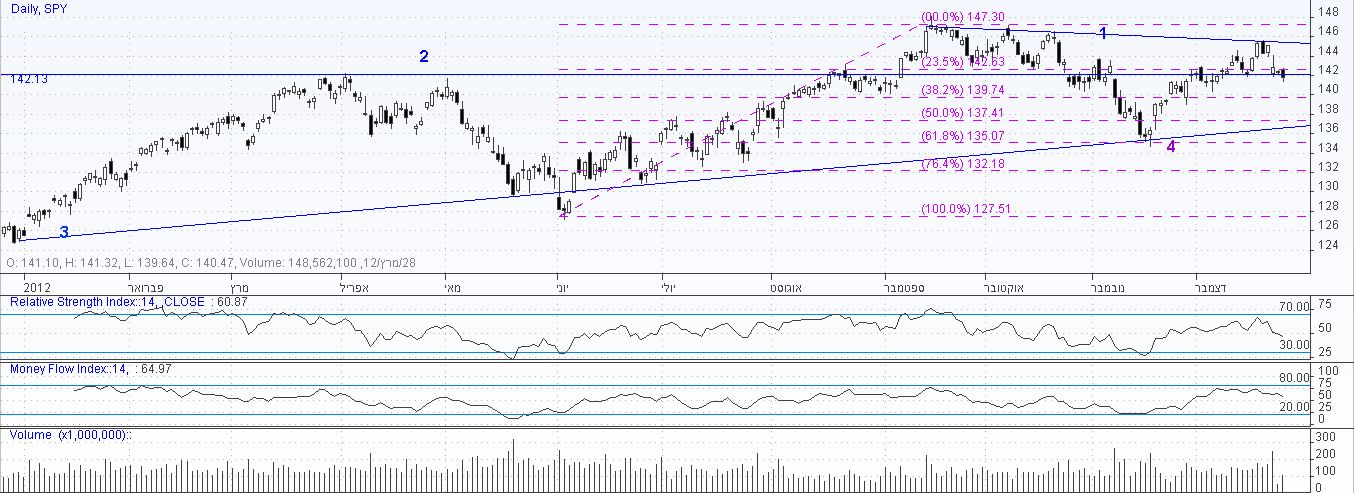
1. resistance line marked as 1.
2. resistance line that became support line marked as 2, on 142.13
3. support line marked as 3.
Note, the more times the graph touches the line, the line is considered stronger and more reliable.
4. fibonacci retracement , marked as 4. we can see that the 61.8% line has stopped the big latest breakdown.
Learn more now!
Sponsored ads:
Sponsored ads:


