Simple Candlesticks patterns – Investing in stocks, bonds, forex and commodity
Formation of candlestick
Candlesticks are graphical representations of price movement for a given period of time. They are commonly formed by the opening, high, low, and closing prices of stock (when investing in stocks – when investing in bonds, forex and commodity they are formed by the appropriate values).
If the opening price is above the closing price then a filled (normally red or black) candlestick is drawn.
If the closing price is above the opening price, then normally a green or a hollow candlestick (white with black border) is shown.
The filled or hollow portion of the candle is? known as body or real body, and can be long, normal, or short depending on its proportion to the line above or below it.
The lines above and below, known as shadows, tails, or wicks represent the high and low price ranges within the specified time period. However, not all candlesticks have shadows.
See how investing in stocks can improve using candlesticks:
|
 Has an unusually long black body with a wide range between high and low. Prices open near the high and close near the low. Considered a bearish pattern. Has an unusually long black body with a wide range between high and low. Prices open near the high and close near the low. Considered a bearish pattern. |

|
| Has an unusually long white body with a wide range between high and low of the day. Prices open near the low and close near the high. Considered a bullish pattern. |

|
| Formed when the opening price is higher than the closing price. Considered to be a bearish signal. |

|
| Formed when opening and closing prices are virtually the same. The length of shadows can vary. |
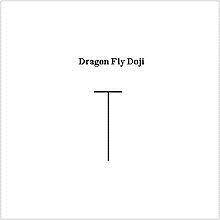
|
| Formed when the opening and the closing prices are at the highest of the day. If it has a longer lower shadow it signals more bullish trend. When appearing at market bottoms it is considered to be a reversal signal. |

|
| Formed when the opening and closing prices are at the lowest of the day. If it has a longer upper shadow it signals a bearish trend. When it appears at market top it is considered a reversal signal. |
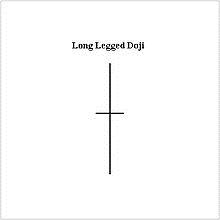
|
| Consists of a Doji with very long upper and lower shadow. Indicates strong forces balanced in opposition. |
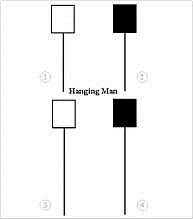
|
| A black or a white candlestick that consists of a small body near the high with a little or no upper shadow and a long lower tail. The lower tail should be two or three times the height of the body. Considered a bearish pattern during an uptrend. |
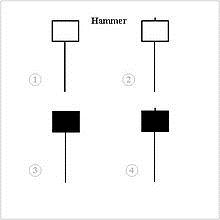
|
| A black or a white candlestick that consists of a small body near the high with a little or no upper shadow and a long lower tail. Considered a bullish pattern during a downtrend. |
|
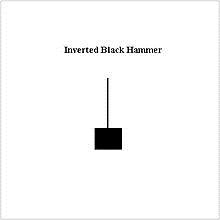
| A black body in an upside-down hammer position. Usually considered a bottom reversal signal. |
|
|
|
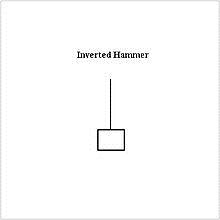
| It consists of black or a white candlestick in an upside-down hammer position. |
|
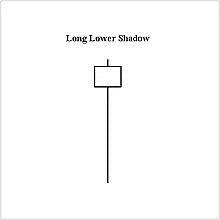
| A black or a white candlestick is formed with a lower tail that has a length of 2/3 or more of the total range of the candlestick. Normally considered a bullish signal when it appears around price support levels. |

|
| A black or a white candlestick with a upper shadow that has a length of 2/3 or more of the total range of the candlestick. Normally considered a bearish signal when it appears around price resistance levels. |
|
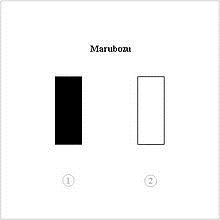
| A long or a normal candlestick (black or white) with no shadow or tail. The high and the lows represent the opening and the closing prices. Considered a continuation pattern. |
|
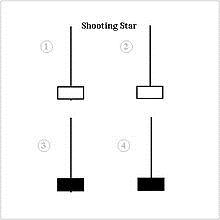
| A black or a white candlestick that has a small body, a long upper shadow and a little or no lower tail. Considered a bearish pattern in an uptrend. |
|
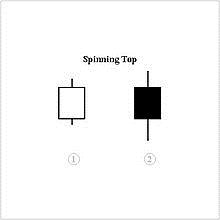
| A black or a white candlestick with a small body. The size of shadows can vary. Interpreted as a neutral pattern but gains importance when it is part of other formations. |
|
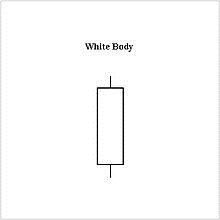
| Formed when the closing price is higher than the opening price and considered a bullish signal. |

|
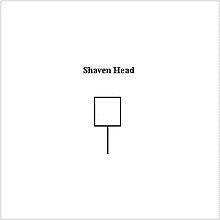
| A black or a white candlestick with no lower tail. |
|
| A black or a white candlestick with no upper |
|
|


