Sponsored ads:
Double bottom / top
Double top and double bottom are reversal chart patterns observed in the technical analysis of financial trading markets of stocks, commodities, currencies, and other assets.
Double top
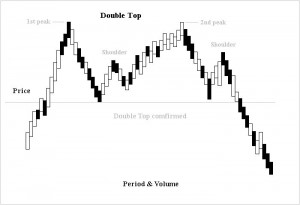
 The double top is a frequent price formation at the end of a bull market. It appears as two consecutive peaks of approximately the same price on a price-versus-time chart of a market. The two peaks are separated by a minimum in price, avalley. The price level of this minimum is called the neck line of the formation. The formation is completed and confirmed when the price falls below the neck line, indicating that further price decline is imminent or highly likely. The double top pattern shows that demand is outpacing supply (buyers predominate) up to the first top, causing prices to rise. The supply-demand balance then reverses; supply outpaces demand (sellers predominate), causing prices to fall. After a price valley, buyers again predominate and prices rise. If traders see that prices are not pushing past their level at the first top, sellers may again prevail, lowering prices and causing a double top to form. It is generally regarded as a bearish signal if prices drop below the neck line. The time between the two peaks is also a determining factor for the existence of a double top pattern. If the tops appear at the same level but are very close in time, then the probability is high that they are part of the consolidation and the trend will resume. Volume is another indicator for interpreting this formation. Price reaches the first peak on increased volume then falls down the valley with low volume. Another attempt on the rally up to the second peak should be on a lower volume.
Sponsored ads:
Double bottom
 A double bottom is the end formation in a declining market. It is identical to the double top, except for the inverse relationship in price. The pattern is formed by two price minima separated by local peak defining the neck line. The formation is completed and confirmed when the price rises above the neck line, indicating that further price rise is imminent or highly likely. Most of the rules that are associated with double top formation also apply to the double bottom pattern. Volume should show a marked increase on the rally up while prices are flat at the second bottom.
continue to next lesson
Sponsored ads:
Sponsored ads:
